
Set up Heatmap and Order Flow
Add order-flow context to your heatmap with an independent EdgeX extension.
Buttons & settings
Heatmap → Plugins → Signals / Thresholds / Activity
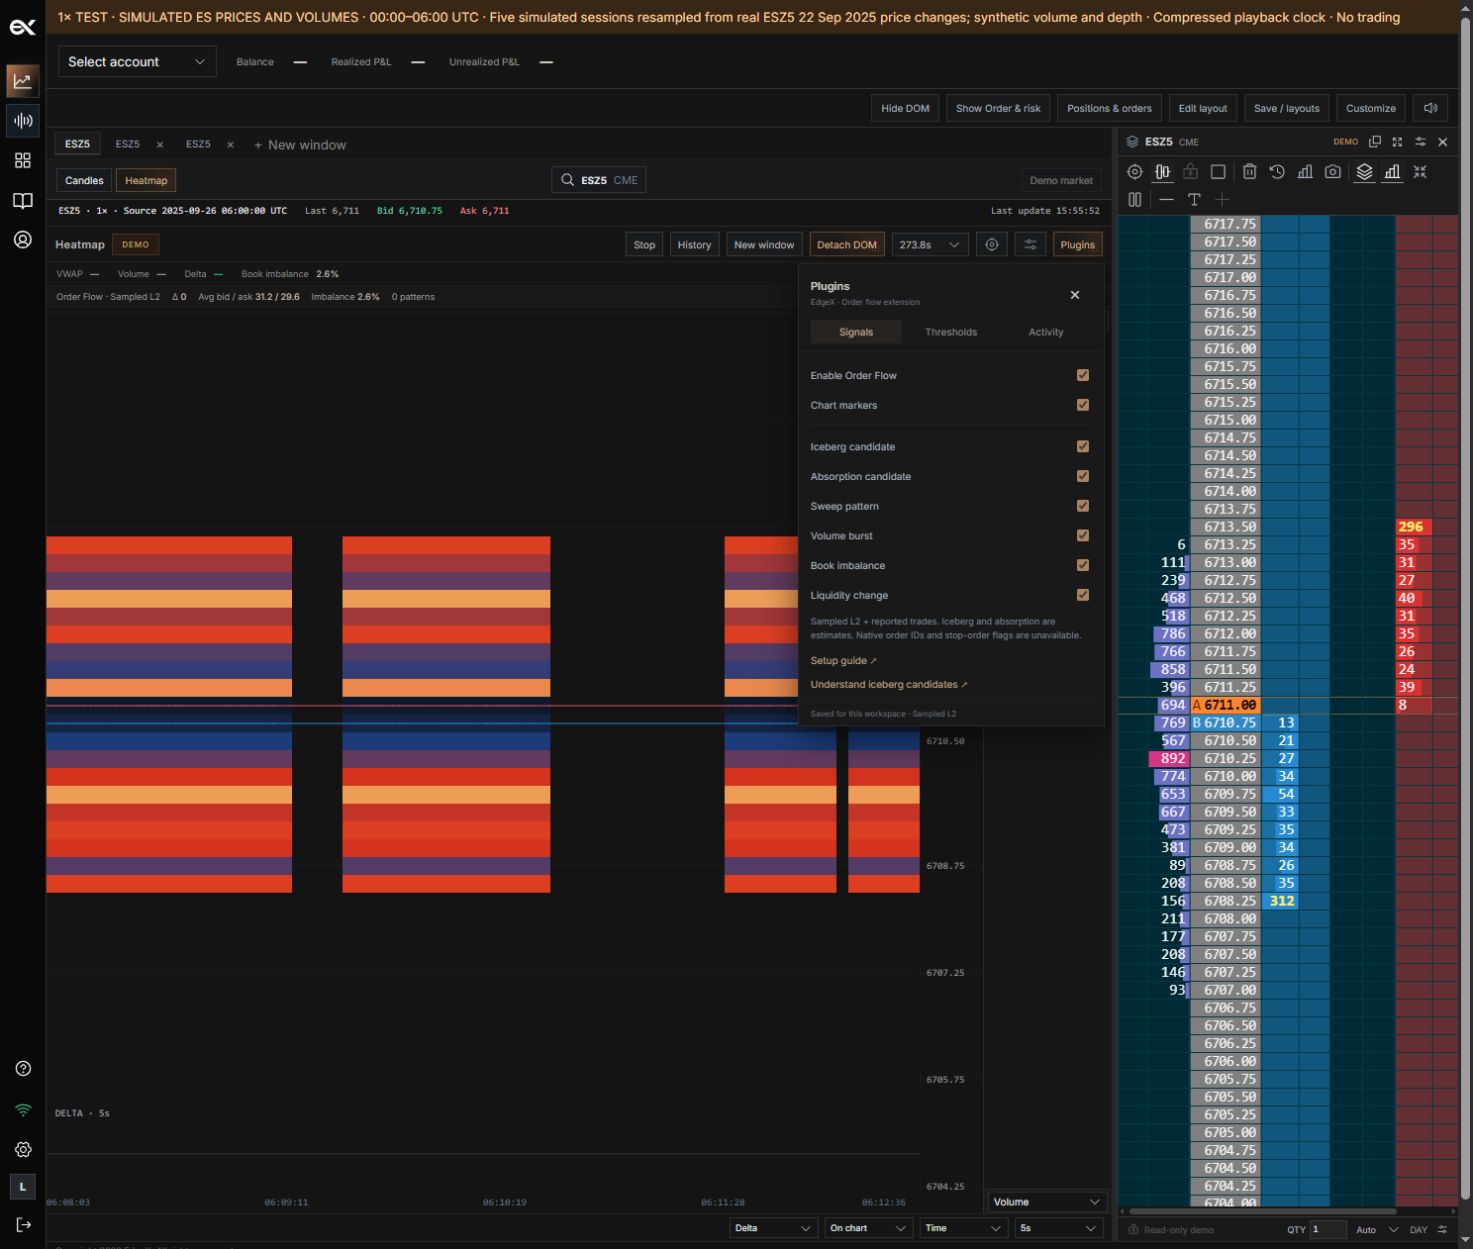
01Enable Order Flow
What it does
Enable the extension calculations.
How to use it
Wait for a complete observation window.
02Chart markers
What it does
Show detected candidates on the heatmap.
How to use it
Turning markers off is different from disabling the extension.
03Iceberg candidate
What it does
Detect replenishment alongside executions.
How to use it
This is inferred activity, not proof of a hidden order.
04Absorption candidate
What it does
Detect size executing within a constrained price span.
How to use it
Adjust window, volume and span together.
05Sweep pattern
What it does
Detect progressing executions across prices.
How to use it
Requires the configured span and directional progression.
06Volume burst
What it does
Detect an execution-volume event above the threshold.
How to use it
Tune thresholds to the instrument.
07Book imbalance
What it does
Compare available bid and ask depth quantities.
How to use it
Positive means more displayed bid liquidity.
08Liquidity change
What it does
Compare quantities at matched prices in consecutive snapshots.
How to use it
Not a pure cancellation counter; executions can reduce depth too.
09Window / Minimum volume
What it does
Set observation duration and directional volume floor.
How to use it
Long windows can combine unrelated trades.
10Refill samples / Executed–visible ratio
What it does
Tune the iceberg-candidate evidence requirements.
How to use it
Raise thresholds for fewer candidates.
11Activity
What it does
Inspect price, time, side and measured evidence.
How to use it
Selecting an observation centers its price.
12Setup guide
What it does
Open the matching Help Center guide.
How to use it
Review data-quality limitations before interpreting signals.
Open the extension
Choose Heatmap in the chart toolbar, then Plugins next to Heatmap settings. The Signals tab lets you enable or disable the extension, chart markers and individual detectors. Heatmap colors and trade dots remain in Heatmap settings.
Check your data first
Confirm the instrument, tick size and connection. DEMO means synthetic data. Connected depth is reconstructed from Rithmic MBO where available. The Order Flow adapter receives sampled, aggregated depth and reported executions, not individual order identities. Wait for a complete analysis window before expecting patterns. A stale book or data gap suppresses new comparisons.
Choose what you see
Signals offers iceberg candidates, absorption candidates, sweep patterns, volume bursts, book imbalance and liquidity changes. Each can be switched off independently. Chart diamonds use I? for iceberg, A? for absorption, SW for sweeps, V for bursts, IM for imbalance and LQ for liquidity. Bid and ask colors refer to the book side being measured; they are not buy or sell instructions.
Inspect and save
Open Activity to see recent observations with price, side and time. Hover a row for its measured evidence. Select it to center its price while the chart continues following live time. Preferences save for your user and workspace. Disable the extension to remove its analysis strip and markers.
Still need a hand?
Get in touch with the EdgeX team.