
Heatmap colors, intensity and trade bubbles
Configure liquidity shading and execution visibility independently.
Buttons & settings
Heatmap → settings → Heatmap / Executions
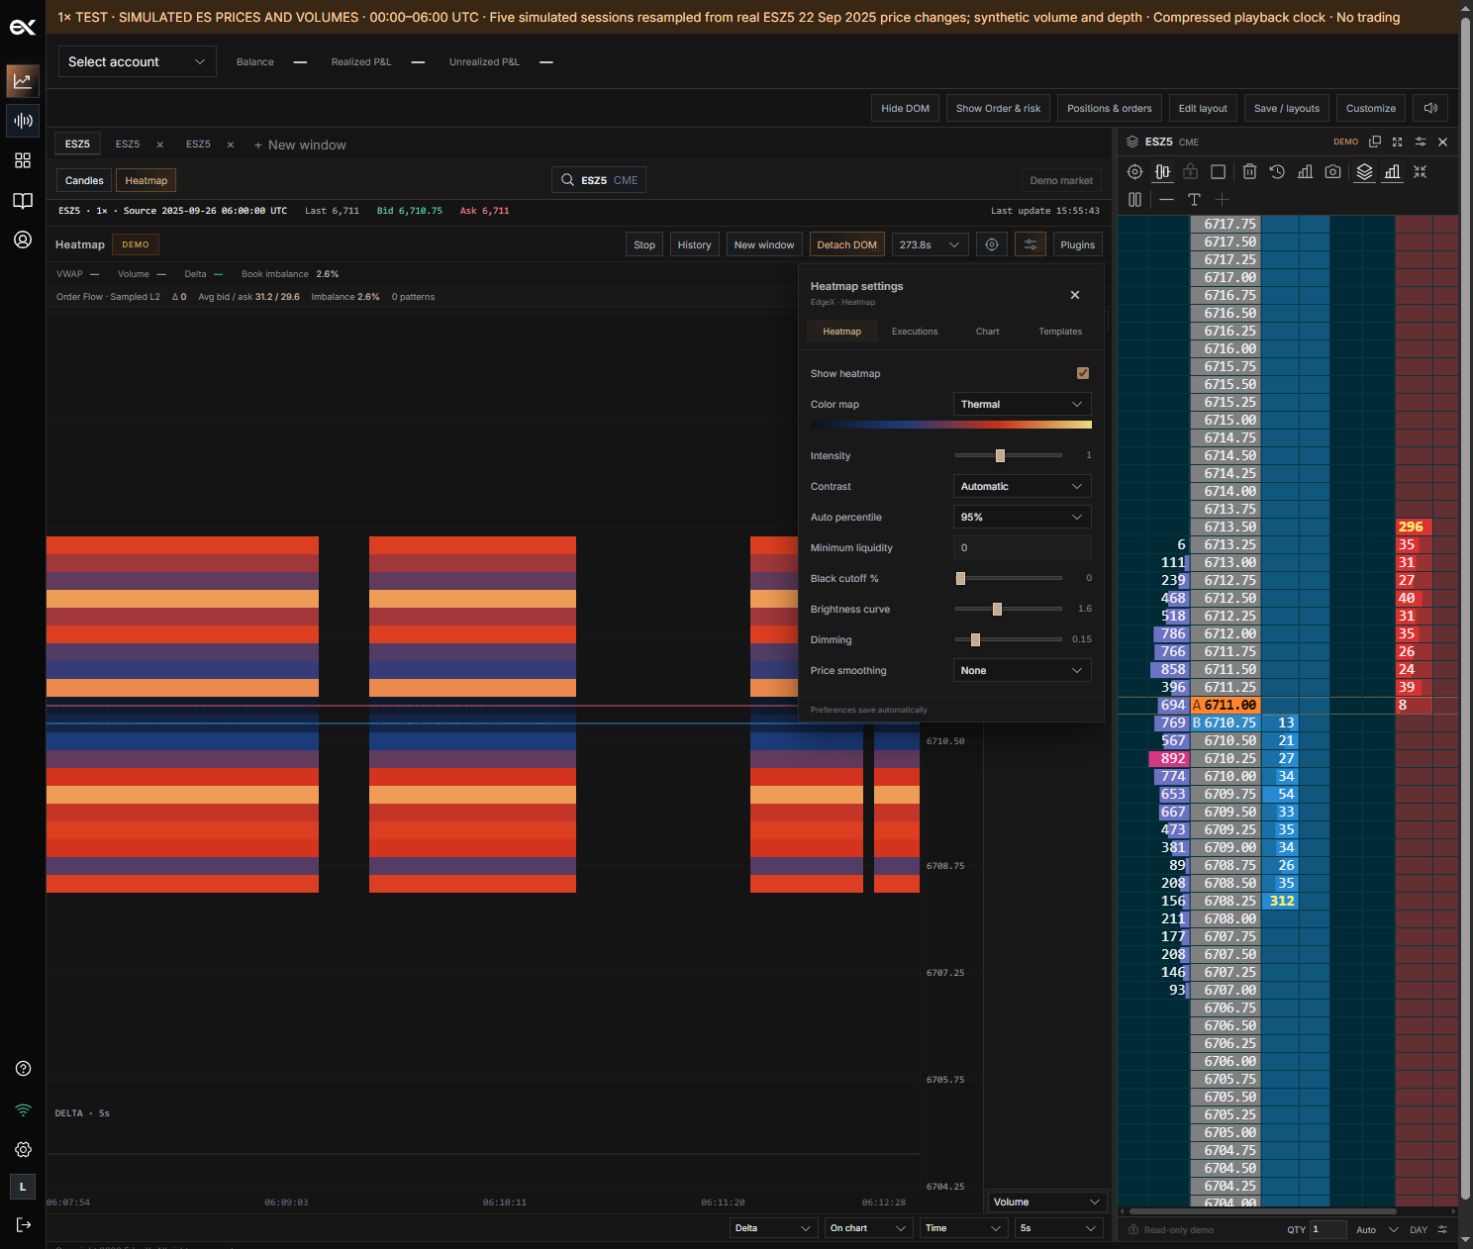
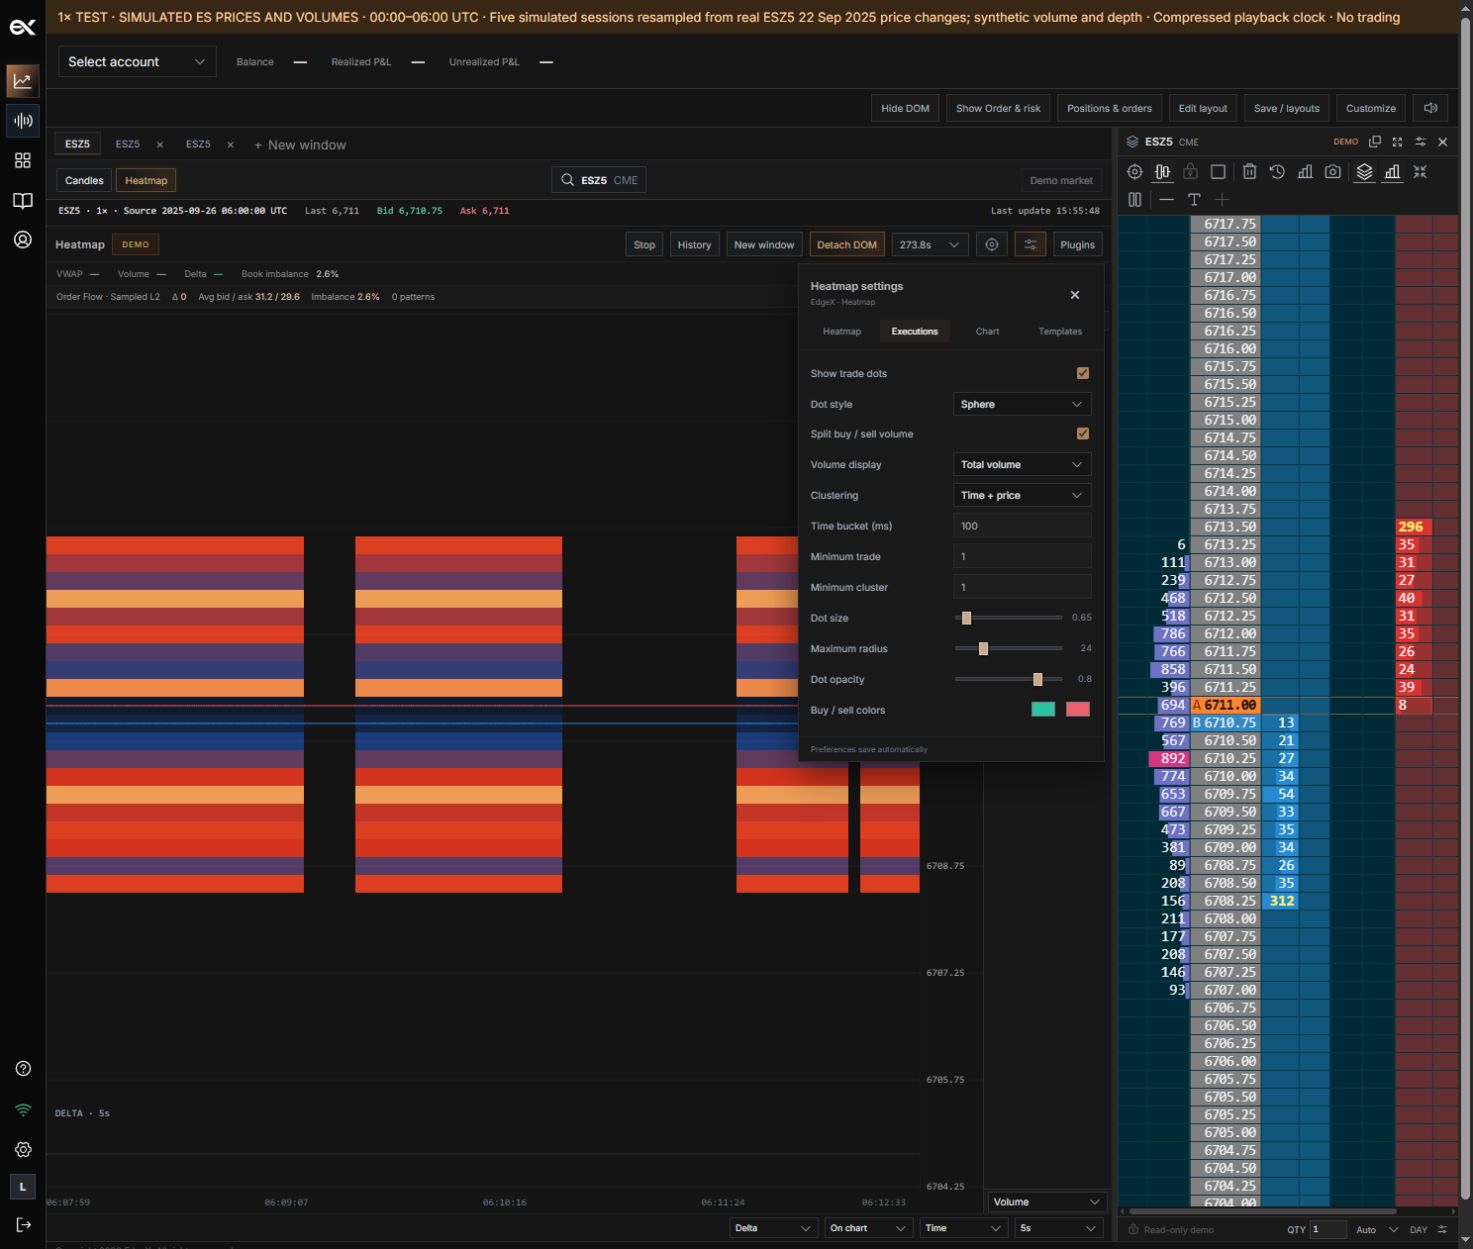
01Show heatmap
What it does
Toggle resting-liquidity shading.
How to use it
Trade bubbles are configured separately.
02Color map
What it does
Choose the liquidity palette.
How to use it
Brightness represents displayed quantity, not executions.
03Intensity
What it does
Change visual color strength.
How to use it
Adjust after selecting the palette.
04Contrast
What it does
Use automatic normalization or manual saturation.
How to use it
Automatic follows the observed distribution; manual uses your fixed reference.
05Auto percentile
What it does
Choose the normalization percentile.
How to use it
Available only with Automatic contrast.
06Manual saturation
What it does
Set the quantity used as the full-intensity reference.
How to use it
Available only with Manual contrast.
07Minimum liquidity
What it does
Filter small displayed depth quantities.
How to use it
Does not filter trade bubbles.
08Black cutoff %
What it does
Suppress the lowest part of the color scale.
How to use it
Raise to reduce weak background activity.
09Brightness curve / Dimming
What it does
Shape the brightness distribution and fading.
How to use it
Change one control at a time.
10Price smoothing
What it does
Choose None, Average or Gaussian.
How to use it
A display treatment, not additional market observations.
11Show trade dots / Dot style
What it does
Toggle executions and choose flat, sphere or sectors.
How to use it
Choose sectors to inspect buy/sell composition.
12Split buy / sell volume
What it does
Show aggressor-side composition.
How to use it
Unknown direction must not be treated as a classified buy or sell.
13Volume display
What it does
Size by total volume or absolute delta.
How to use it
Net delta can be small even when total volume is large.
14Clustering
What it does
Choose individual, time + price, price, price + side, volume or screen grid.
How to use it
Clustering combines prints for display.
15Time bucket / Screen bucket
What it does
Set aggregation duration or pixel size for the selected mode.
How to use it
Only the applicable control is displayed.
16Minimum trade / Minimum cluster
What it does
Filter small executions or clusters.
How to use it
In volume clustering, Volume bucket sets the target bucket quantity.
17Dot size / Maximum radius
What it does
Set marker scale and size cap.
How to use it
A cap prevents a large event from covering the chart.
18Dot opacity / Buy–sell colors
What it does
Set transparency and side colors.
How to use it
Use readable contrast against the heatmap.
Liquidity shading
Open Heatmap settings → Heatmap. Select a color map and adjust intensity, contrast, minimum liquidity, brightness and dimming. Colors represent displayed liquidity at each sampled price and time; bright shading does not mean an execution occurred.
- Start with a color map that is readable on your dashboard.
- Set the minimum liquidity to filter small resting sizes.
- Adjust intensity and contrast until both smaller and larger levels remain distinguishable.
Execution bubbles
In Executions, choose the measure and aggregation, size limits, sensitivity, opacity and buy/sell colors. Qualifying volume determines marker size. Split markers show the buy/sell composition of the bucket; net delta and total volume are different measures.
Keep comparisons meaningful
Apply the same settings when comparing windows. Raising minimum size filters small events; raising dot scale changes how large qualifying events look. Aggregation can combine several prints into one marker.
Still need a hand?
Get in touch with the EdgeX team.