The essentials
- Read executed volume alongside location and price response.
- Calculate delta and diagonal imbalances before interpreting their colors.
- Define a trigger, invalidation and risk limit before considering a trade.
What is a footprint chart?
A footprint chart displays trading activity at price levels inside each bar. A conventional candle shows the open, high, low and close. The footprint adds a view of where volume executed during that same interval. This helps answer a more precise question: did aggressive activity move the market, or did price struggle to progress?
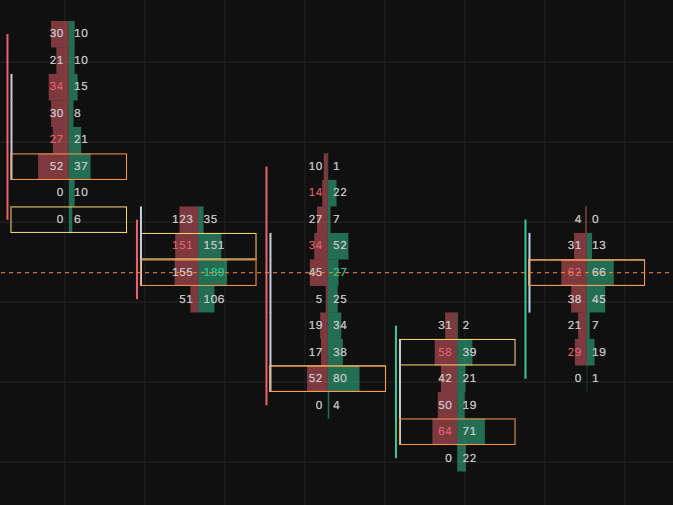
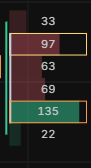
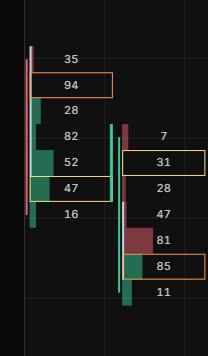
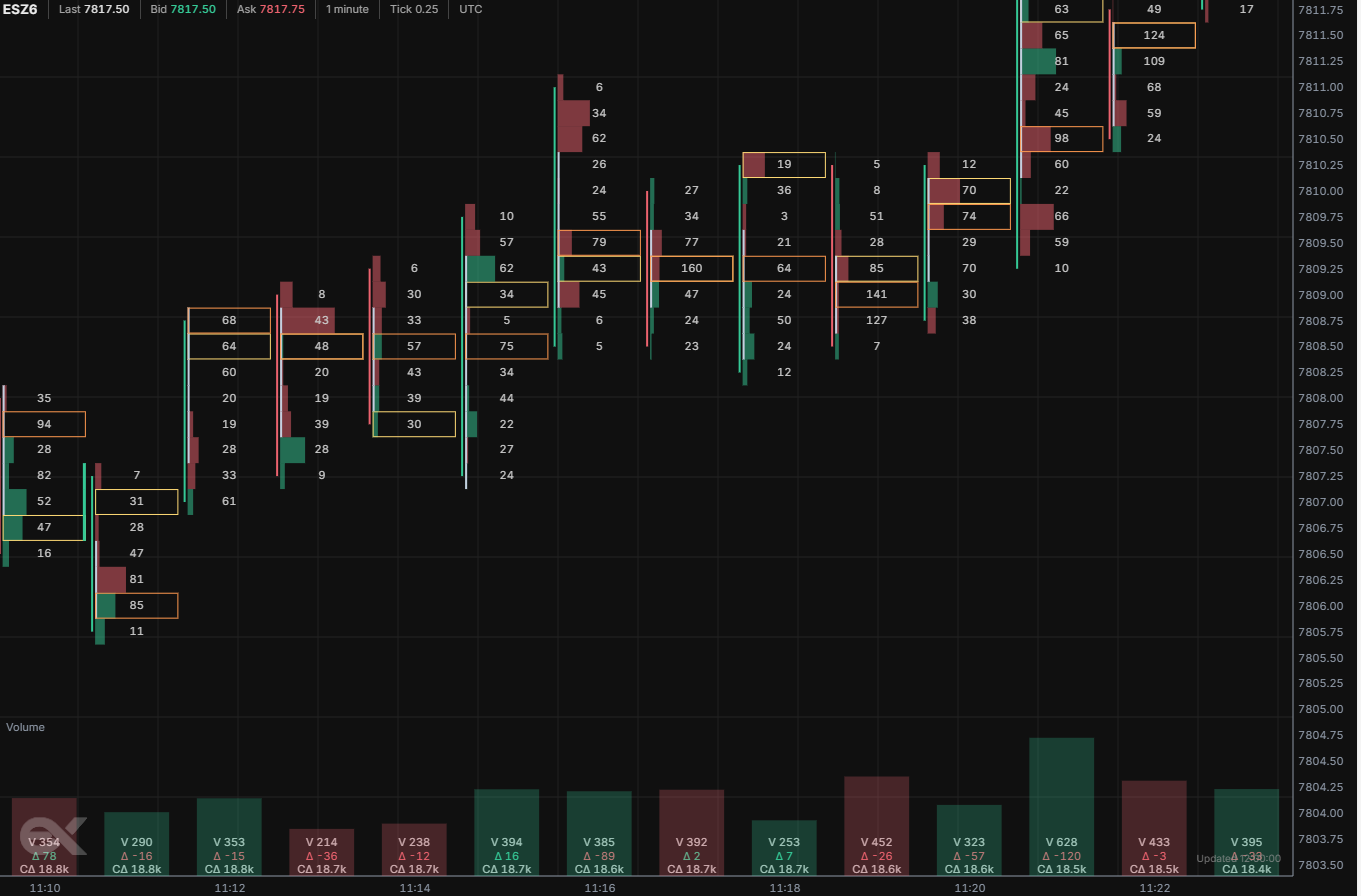
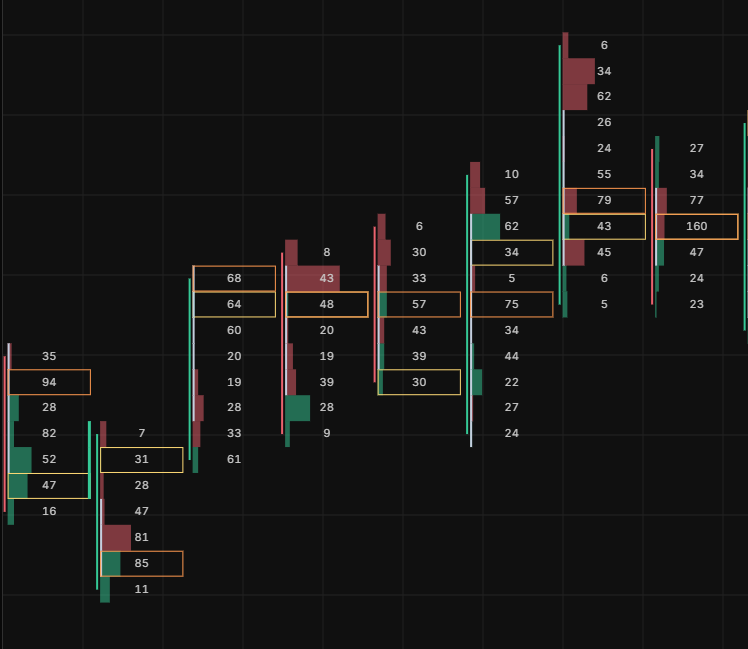
EdgeX uses a two-sided footprint: Bid on the left and Ask on the right. Bid × Ask, delta and total volume are different numeric views of that structure. The price belongs to the chart axis; it is not a third footprint side. The screenshots throughout this guide show the supplied EdgeX chart examples.
Start with the distinction between executions and resting orders. Footprints record trades that have already occurred. The DOM and liquidity heatmap describe displayed orders and changes in the book. A large footprint number is completed activity, not a promise that the same quantity remains available.
The useful reading sequence is location, activity, response. Identify a meaningful reference level, inspect the trading there, then observe whether price accepts the area or rejects it. Reversing that sequence encourages you to chase whichever cell happens to be brightest.
Reading Bid × Ask at a single price
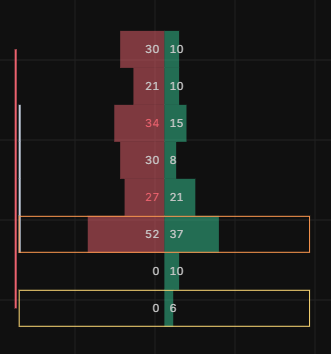
In a Bid × Ask display, the left value represents volume classified as trading at the bid; the right represents volume classified as trading at the ask. Bid-side executions are commonly described as aggressive selling, while ask-side executions are described as aggressive buying. Every execution still has both a buyer and a seller.
For example, 38 × 45 means 38 contracts traded on the bid side and 45 on the ask side at that displayed price during the bar. It does not mean 38 sellers faced 45 buyers. Volume counts contracts, not unique people or independent decisions. Verify the column order and classification method before reading a different platform.
Reference: Sierra Chart: Numbers Bars definitions and calculations
A footprint candle, row by row
Read the rightmost candle in the supplied Bid × Ask sequence from top to bottom. The table below transcribes its visible values. Row numbers describe position within the crop; no price or timestamp is invented for an image without a visible axis.
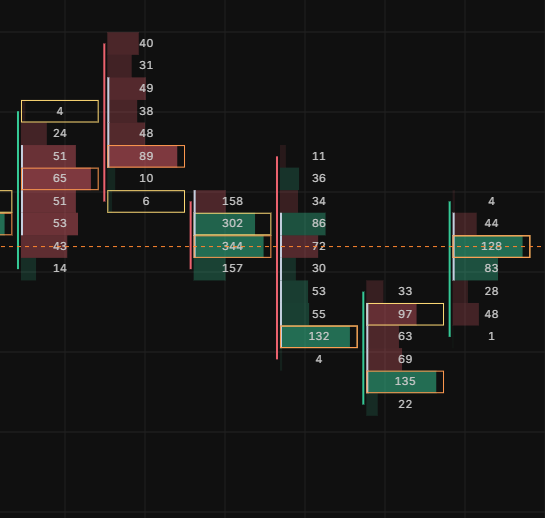
| Row (top to bottom) | Bid volume | Ask volume | Total | Delta |
|---|---|---|---|---|
| 1 | 4 | 0 | 4 | −4 |
| 2 | 31 | 13 | 44 | −18 |
| 3 | 62 | 66 | 128 | +4 |
| 4 | 38 | 45 | 83 | +7 |
| 5 | 21 | 7 | 28 | −14 |
| 6 | 29 | 19 | 48 | −10 |
| 7 | 0 | 1 | 1 | +1 |
Delta describes aggression, not the next candle
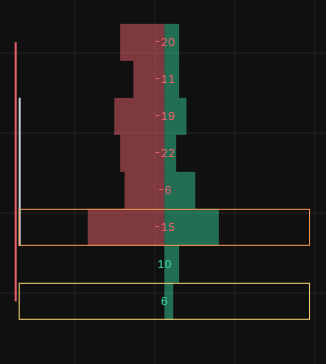
Delta is ask volume minus bid volume. A positive value means more volume was classified on the ask side; a negative value means more was classified on the bid side. Row delta applies to one price, while bar delta adds the values across the bar. Cumulative delta adds successive deltas over a defined period.
In the worked example, delta is −34. Dividing by the 336 classified contracts gives approximately −10.1%. Check the denominator used by your platform if it includes volume whose aggressor side is unknown. Missing classification should not silently become buying or selling.
A negative-delta candle can close higher. The market may trade heavily at the bid early, find responsive buying, and then recover on less volume. The completed candle compresses this sequence. Compare its close, range and neighboring bars before treating the disagreement as a meaningful signal.
Diagonal imbalances and stacked imbalances
A diagonal comparison evaluates opposing sides at adjacent prices. Under a common convention, buy dominance compares ask volume at a price with bid volume one row below. Sell dominance compares bid volume with ask volume one row above. This differs from subtracting the two numbers on the same row.
Consider an illustrative buy comparison: 120 ask contracts at 5,625.50 against 30 bid contracts at 5,625.25. The ratio is 4:1, which exceeds an example threshold of 3:1. A comparison of 60 against 30 is only 2:1. These thresholds describe display rules; they do not establish a profitable strategy.
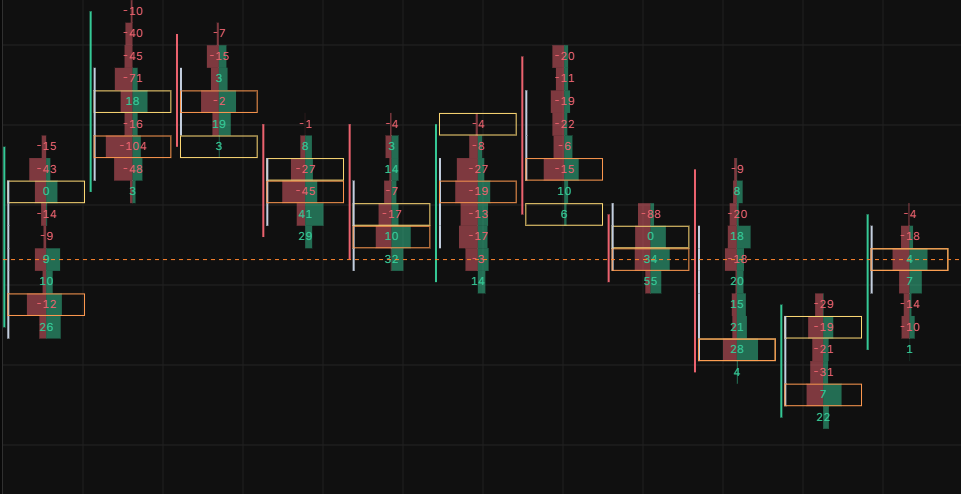
A stacked imbalance requires consecutive qualifying rows on the same side, according to the chosen settings. Three isolated highlights are not a three-row stack. Check the minimum volume filter, row aggregation and handling of zero denominators. A ratio against zero is undefined unless the platform applies a special convention.
Absorption versus exhaustion
Absorption is a possible explanation when substantial aggressive trading produces limited progress at a level. Repeated selling near support, followed by an inability to extend lower, may indicate responsive buying meeting that pressure. The footprint supports an observation about effort and response; it does not reveal the identity or full position of the passive participant.
Exhaustion describes a different observation: participation fades as price extends toward an extreme. Small prints at a high can be consistent with buying losing urgency, but low volume can also reflect the time of day, a short-lived visit or incomplete data. A zero at the extreme is not proof of a completed reversal.
Separate the observation from confirmation. Heavy selling without lower progress is the observation. A reclaim of the level, a failed retest below it, or a change in subsequent price behavior can be confirmation under a predefined research rule. If price accepts below support, the original reversal hypothesis has weakened or failed.
Bar POC, session context and price acceptance
The bar point of control is the row with the largest total volume in that bar, subject to the chart’s aggregation and tie rules. In our transcribed table, it is row 3, with 128 contracts. It identifies the busiest displayed price, not a guaranteed support level. A session Volume Profile summarizes a much longer interval and answers a different question.
Compare the bar POC with the close and with neighboring bars. Repeated trade above a reclaimed area is different from a brief spike that immediately returns below it. Neither one candle nor a single POC location is enough to define acceptance; state the time or number of bars required by your observation process.
Mark your reference levels before examining the footprint in detail. Prior session highs and lows, an opening range boundary, and clearly defined value-area levels are possible candidates. Selecting the level only after seeing a successful reversal introduces hindsight into your review.
ES worked scenario: a support reclaim
Imagine ES approaching a previously marked support zone at 5,625.00. Selling increases around and just below the zone, yet the next push makes little additional downside progress. That is a candidate for further observation, not an instruction to buy.
Define the research trigger in advance: for example, a completed bar back above the zone followed by a retest that holds above the observed low. Define failure separately: renewed acceptance below the zone or a breach of the structural low. If the reclaim never develops, there is no qualifying setup under that rule.
For an illustrative entry at 5,626.00 and a protective stop at 5,624.00, the distance is 2.00 points, or eight ticks. ES has a $50 point value and a $12.50 tick value, so the planned price risk is $100 per contract before commissions, fees and slippage. Actual losses can exceed the planned amount.
Reference: CME Group: E-mini S&P 500 contract specifications
- Location: identify support before the reaction.
- Activity: observe selling and limited downside progress.
- Trigger: require the defined reclaim and retest.
- Invalidation: identify where the hypothesis fails.
- Review: record qualifying failures as well as successes.
NQ worked scenario: continuation after a retest
Imagine NQ breaking above a predefined range boundary with consecutive buy imbalances. The useful question is whether the market can remain above the breakout area. A stack that appears late in an extended move can also mark aggressive buyers entering just before the move stalls.
For a continuation study, require a pullback toward the breakout area, limited downward progress and renewed buying accompanied by upward price progress. Define the retest boundaries before the event. If the market returns into the old range and remains there, do not relabel the failed breakout as a successful continuation.
NQ has a 0.25-point tick and a $20 point value, making each tick worth $5 per contract. An illustrative 10-point stop distance represents 40 ticks and $200 of planned price risk per contract before costs. The same contract count or number of ticks used for ES does not imply the same dollar exposure.
Reference: CME Group: E-mini Nasdaq-100 contract specifications
Build a readable footprint workflow in EdgeX
Begin with the correct contract, expiry and connected data source. Confirm that the chart contains classified trade information for the period you intend to study. Ordinary OHLCV candles do not contain enough information to reconstruct exact historical Bid × Ask rows. A blank region must not be interpreted as an absence of trading.
Choose a consistent bar interval and price aggregation. A one-tick row preserves more detail; grouping several ticks can improve readability but changes the comparison being made. Keep these settings fixed during a study so that a change in highlighting is not mistaken for a change in the market.
Use enough chart space to read the values comfortably. Review the broader price structure first, then zoom into the relevant bars. Keep a record of the ratio threshold, minimum volume, stack length, session boundaries and any filters. Use the Help Center to confirm the controls available in your workspace.
Combine views only when each answers a distinct question: a price chart for structure, the footprint for executions, and the DOM or heatmap for displayed liquidity. If two panels simply repeat the same evidence, additional color does not make the conclusion stronger.
A repeatable practice and review checklist
Pick one contract, one session window and one observation rule. Before looking ahead, save the location, footprint settings, trigger and invalidation. Then reveal subsequent price action and score the example against the original rule. This prevents an attractive outcome from rewriting your entry criteria.
Record whether the trigger occurred, the hypothetical entry and exit assumptions, costs, maximum adverse movement and maximum favorable movement. Include missed triggers, failed reactions and periods when the data was incomplete. Keep a separate group of later sessions for checking whether the observation survives outside the examples used to define it.
Common mistakes include comparing ES and NQ raw volumes as if they had identical participation, changing thresholds after every losing example, calling every large print absorption, and buying solely because delta is positive. A better journal states what the market did and which condition failed, without inventing the intentions of unseen participants.
| Before the event | During the event | After the event |
|---|---|---|
| Mark the level and session | Read Bid × Ask and price response | Save the complete sequence |
| Fix chart settings | Check the predefined trigger | Include failures and costs |
| Define invalidation and risk | Record missing or ambiguous data | Review without changing the original rule |
Common questions
What is the difference between a footprint chart and Volume Profile?
A footprint separates activity into individual bars and price rows. Volume Profile aggregates activity across a selected interval. They can share volume-at-price data while answering different questions about timing and distribution.
Is positive delta a buy signal?
No. It describes more ask-side than bid-side classified volume. Price can still fall if that aggression does not produce sustained upward progress.
What is the best footprint imbalance setting?
There is no universal setting. Define the ratio, minimum volume, aggregation and stack length, then evaluate the same rules across comparable sessions. A 3:1 ratio is an example configuration, not a performance claim.
Can I reconstruct a footprint from ordinary candles?
Not exactly. OHLCV bars do not preserve the executed Bid × Ask distribution at every price. Historical footprint accuracy depends on the underlying trade data and classification.
Can the same workflow be used for ES and NQ?
The observation sequence can be similar, but tick values, participation and price behavior differ. Calibrate risk and evaluate examples separately for each contract.
Continue with the EdgeX product guides
These guides document the controls and data behavior used in this article.
Published by EdgeX Terminal, operated by EdgeProp Trading S.R.L. Product explanations are based on the EdgeX Help Center; external references are linked beside the relevant discussion. Chart examples use supplied EdgeX screenshots; hypothetical trade scenarios are identified separately. Screenshots do not establish trading results. Futures trading involves risk; this material is education, not an individual trading recommendation.
Suggest a correction