The essentials
- Delta measures classified execution imbalance, not net new positions.
- A reset point and complete history are essential for comparisons.
- Price–delta divergence is a research observation, not a reversal guarantee.
What volume delta actually measures
For a chosen interval, subtract sell-aggressor volume from buy-aggressor volume. Positive delta means more classified volume took the ask than the bid under that method. It does not mean there were more buyers than sellers in matched trades, and it does not reveal whether either side opened or closed a position.
Sierra Chart documents cumulative delta using ask-volume and bid-volume differences and notes its dependence on suitable intraday data. Use that as a reminder to inspect inputs whenever two displays disagree, rather than assuming the more dramatic plot is more accurate.
Reference: Sierra Chart: Cumulative Delta Bars — Volume
Follow the arithmetic before interpreting the line
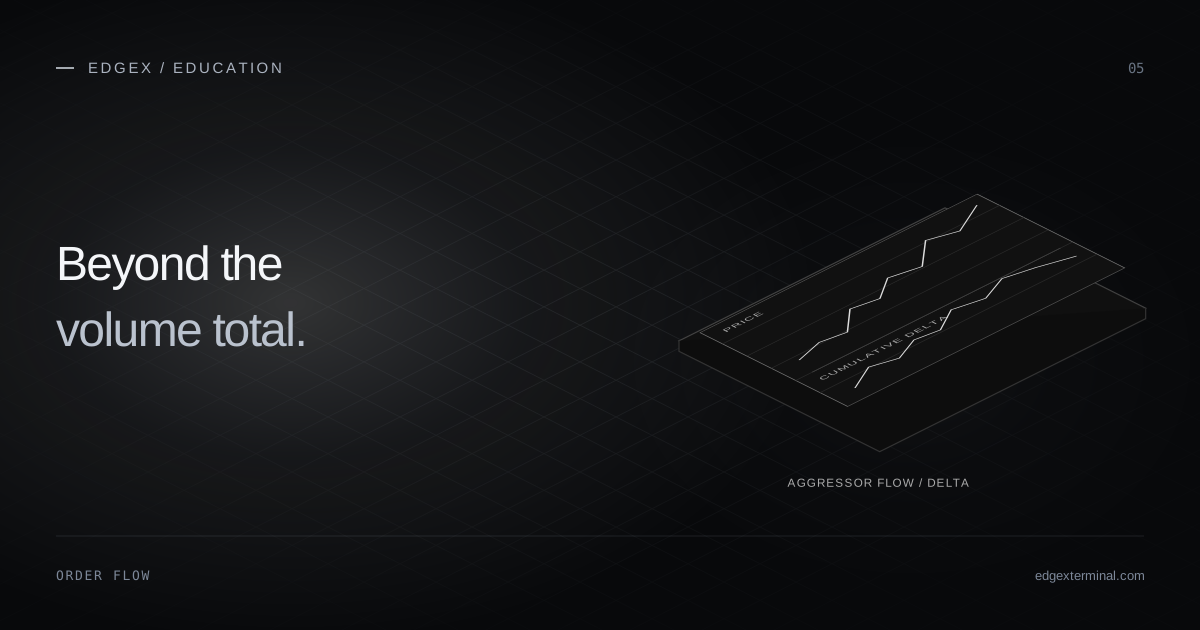
A cumulative series needs a starting point. If successive observed intervals have delta +45, −20 and +10, a series starting at zero finishes at +35. Starting later or resetting at another boundary produces another value. That is not automatically a contradiction; it may describe another sample.
In EdgeX’s execution-based views, unknown aggression contributes to total volume where documented but is excluded from directional delta. Therefore the sum of classified buy and sell volume can be smaller than total volume. Unknown quantity should remain visible as a limitation, rather than being forced into whichever side makes a pattern look convincing.
Read price and delta together, cautiously
Suppose price makes little upward progress while classified buy aggression increases. You can describe that combination as buying activity with limited price response. It may prompt a closer look at opposing liquidity, but it does not establish that a reversal must follow. The same visual pattern can occur before continuation, consolidation or a feed-related discrepancy.
Define divergence before collecting examples. Specify the interval, price reference and reset boundary. Then record what follows over a fixed horizon, including observations that do not support the idea. Without those definitions, a reviewer can choose different swing points until almost any chart appears to confirm a preferred story.
Use delta in an EdgeX workspace
The indicator manager lets you add available execution-based studies, including cumulative delta, and place a supported oscillator in a separate pane. A synchronized crosshair helps compare a price bar with its indicator value at the same time. In Heatmap, the attached data column and bottom study can also display delta using their documented aggregation controls.
Choose a time or tick interval that matches your question. Time bars group a duration; tick bars group a number of executions. Switching between them changes the observation buckets. A short tick bar and a one-minute bar should not be expected to show the same sequence, even when both use the same trades.
Resolve data differences before creating a signal
Historical candles can load while execution history remains partial. Candles alone do not recreate aggressor classification. If delta looks unexpectedly quiet, check contract expiry, feed freshness, captured history and the study’s interval before changing thresholds. A blank period is not proof that the market had no directional activity.
EdgeX’s practical advantage is that these studies can sit beside the price chart and liquidity views, making discrepancies easier to inspect. Keep a short record of study settings and coverage with each research session. The most useful line is one whose inputs you understand, not necessarily the one with the clearest apparent divergence.
Common questions
Can delta be positive while price falls?
Yes. Classified execution imbalance and price change describe different measurements. Available opposing liquidity, the selected interval and data coverage all matter; positive delta is not a price-direction promise.
Can cumulative delta be rebuilt from ordinary candles?
OHLC candles alone do not contain the classified executions needed for a trade-based cumulative delta series. Suitable execution history is required.
Continue with the EdgeX product guides
These guides document the controls and data behavior used in this article.
Published by EdgeX Terminal, operated by EdgeProp Trading S.R.L. Product explanations are based on the EdgeX Help Center; external references are linked beside the relevant discussion. Examples are illustrative, not actual trading results. Futures trading involves risk; this material is education, not an individual trading recommendation.
Suggest a correction