The essentials
- A profile measures executed volume, not currently resting liquidity.
- Session boundaries and ticks per row materially change the result.
- POC and value area need complete, comparable input data.
Read a distribution, not a prediction
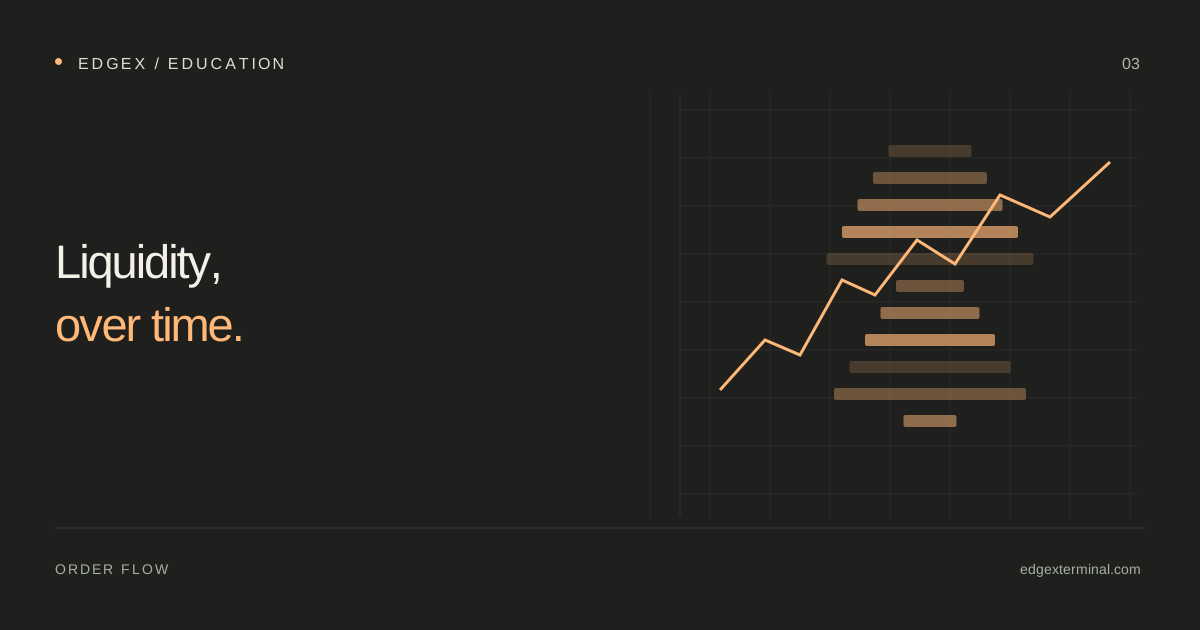
A time-based volume histogram asks how much traded during each interval. A Volume Profile asks how much traded at each price row. The widest row is the Point of Control, or POC. Value Area High and Low mark the bounds of a chosen share of the distribution under the platform’s calculation method. These are descriptive reference levels, not automatic entry or exit instructions.
Sierra Chart’s Volume by Price documentation illustrates how profiles depend on their selected period and settings. When comparing products, check the dataset, row size and session definition first. Similar labels do not guarantee identical calculations.
Reference: Sierra Chart: Volume by Price reference
How EdgeX calculates its profile levels
In EdgeX, POC is the row with the largest total volume; equal maxima select the lower row. Value area expands from POC through adjacent occupied rows until the selected percentage is covered, choosing the upper row when adjacent volumes are equal. VAH and VAL are the outer rows reached by that process.
POC and value area use total volume even if the display is set to delta. Profile VWAP weights actual execution prices by size. Unknown-aggression trades still contribute to total volume, but they are not assigned to either side of delta. These details make the numbers easier to reconcile with the executions you actually received.
Choose the session before interpreting the shape
Open Profile settings after enabling Volume Profile. Select Visible range, Each calendar day, Each session or All retained trades. For daily and session grouping, choose a timezone. For a session profile, also choose its local start time. A calendar-day profile and a session profile answer different questions.
Chicago and New York timezone choices follow daylight saving. The configured boundary is not an exchange holiday calendar. A session beginning at your selected time runs until that time on the next local day; changing the boundary reallocates trades among profiles. Document it if you want to compare two days or share a chart with another trader.
Row size, value area and coverage
Ticks per row sets price aggregation. A larger row combines nearby prices, which can smooth the shape and move the largest row. The value-area percentage controls how much total activity the highlighted area aims to cover. Neither control fixes missing executions. Five days of candles do not establish five complete days of trade-level profile data.
Use the coverage notices and your connection history when deciding whether a profile is suitable for comparison. If the sample begins halfway through a session, describe it as a partial-session profile. Calling it a full session would give its levels more authority than the data supports.
- Match contract expiry, timezone and session start.
- Keep ticks per row and value-area percentage consistent.
- Check whether all compared periods have execution coverage.
- Distinguish a visible-range profile from a full-session profile.
Put the profile to work as context
One research exercise is to mark a completed, sufficiently covered profile and record how later price behaves around its high-activity and low-activity regions. Define the observation interval in advance. Include both acceptance and rejection examples, and record transaction costs if the exercise later becomes a trading simulation.
EdgeX combines profile context with current chart, DOM and heatmap views. You can use the profile to organize the question, then inspect recent transactions and visible liquidity for the current response. That integration reduces view switching; it does not turn a historical volume concentration into guaranteed future support.
Common questions
Is Volume Profile the same as Market Profile?
No. Volume Profile aggregates traded quantity by price. Time-based profile methods summarize time or opportunities at price. Compare the underlying measurement before comparing their levels.
Why do POC values differ between two charts?
Check contract, data coverage, period, timezone, ticks per row and tie-breaking rules. A difference can come from configuration or missing trades rather than an error in arithmetic.
Continue with the EdgeX product guides
These guides document the controls and data behavior used in this article.
Published by EdgeX Terminal, operated by EdgeProp Trading S.R.L. Product explanations are based on the EdgeX Help Center; external references are linked beside the relevant discussion. Examples are illustrative, not actual trading results. Futures trading involves risk; this material is education, not an individual trading recommendation.
Suggest a correction