
Add, configure and remove indicators
Indicator parameters, separate panes and synchronized crosshair values.
Buttons & settings
Chart toolbar → Indicators… → select an indicator
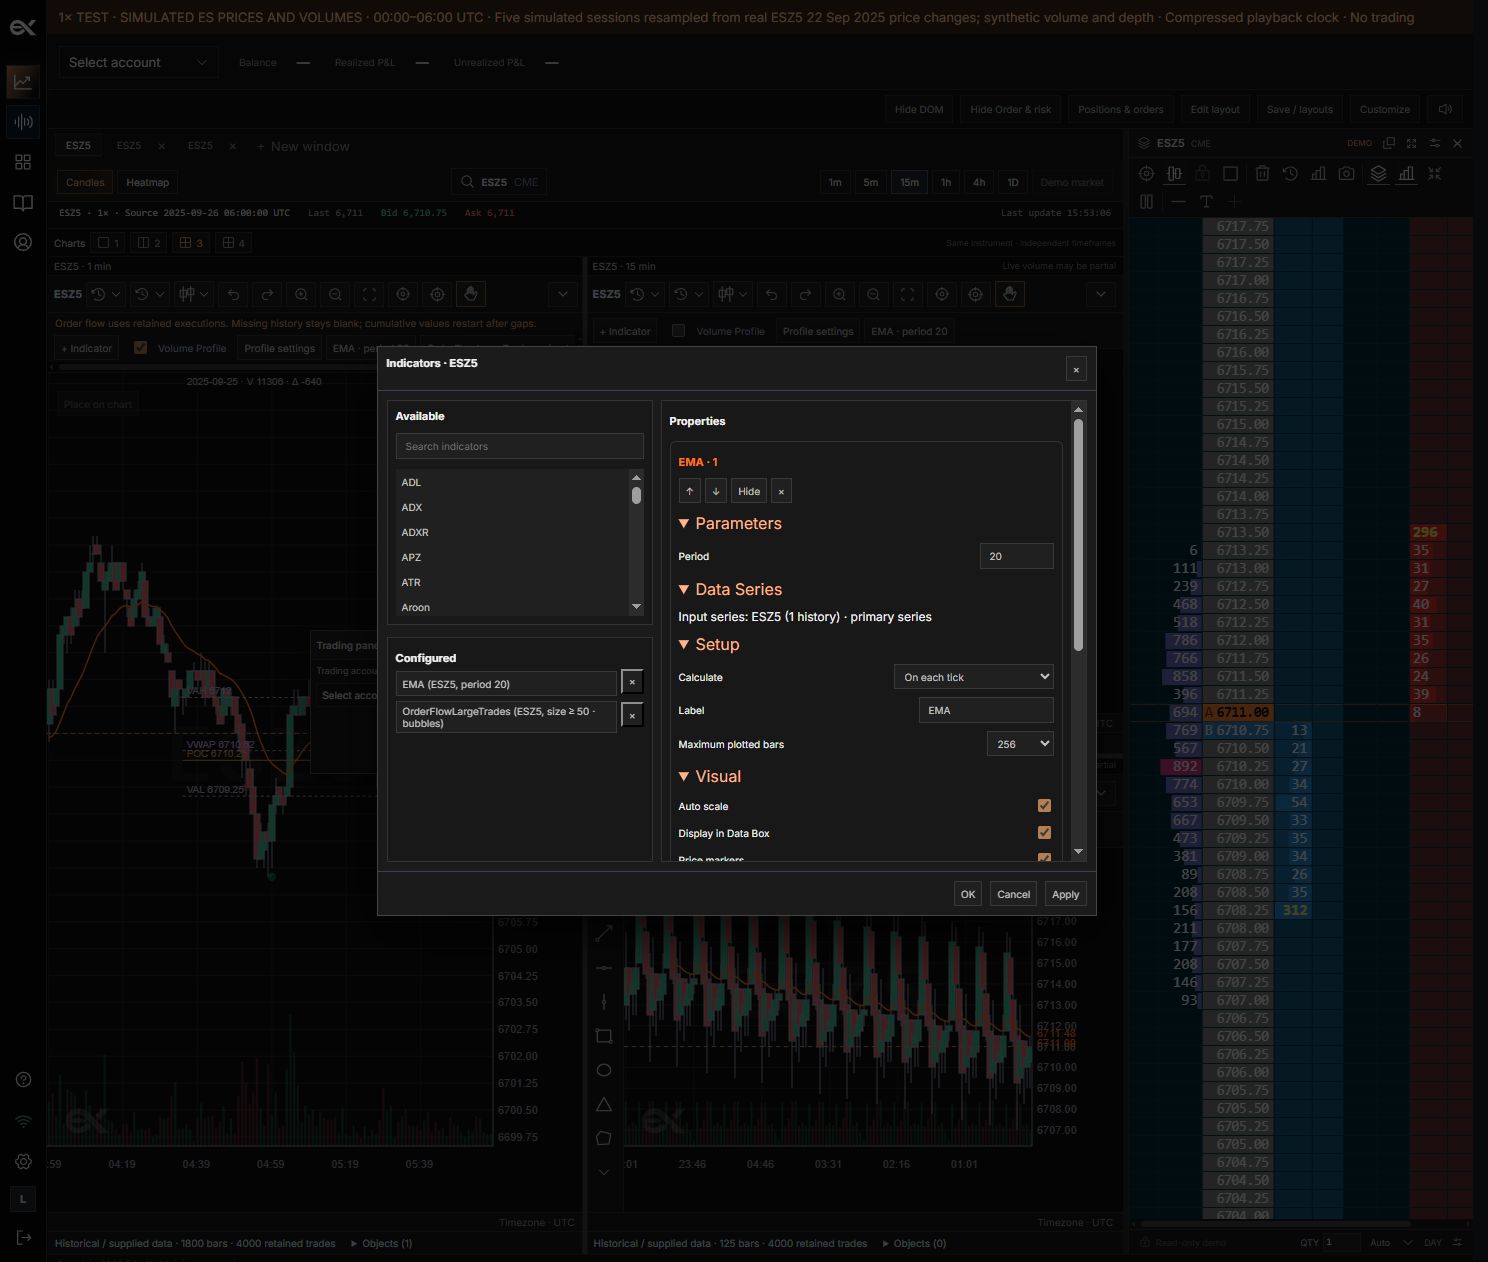
01Search indicators
What it does
Filter the available indicator list.
How to use it
Type the indicator name in Available.
02Add indicator
What it does
Add a separately configured instance.
How to use it
Select an available name, then configure that instance.
03Period / input parameters
What it does
Set the calculation inputs for that indicator.
How to use it
Use only parameters exposed by the selected indicator; not every indicator has a period.
04Plot appearance
What it does
Configure the exposed line and display options.
How to use it
Different plots can use different colors and widths.
05Hide / Show
What it does
Control visibility without removing the instance.
How to use it
Use the configured indicator editor.
06Remove
What it does
Delete that configured indicator.
How to use it
Other indicator instances remain unchanged.
07Pane divider
What it does
Resize a separate indicator pane.
How to use it
Drag the divider; crosshair time remains aligned with the price chart.
08Calculate
What it does
Choose On each tick or On bar close.
How to use it
On price change is disabled until its scheduler is available.
09Label
What it does
Set the display name for this instance.
How to use it
Use distinct names for multiple instances.
10Maximum plotted bars
What it does
Limit rendered output to 256, 512 or Infinite.
How to use it
Calculation warm-up can use earlier available data.
11Auto scale
What it does
Allow the indicator to influence its scale.
How to use it
Disable when an overlay stretches the price range unnecessarily.
12Display in Data Box
What it does
Show the indicator value at the crosshair.
How to use it
Uses the selected time coordinate.
13Price markers
What it does
Toggle plot markers at the scale.
How to use it
Useful for price overlays.
14Displacement
What it does
Shift the plotted output by a number of bars.
How to use it
This is visual placement, not future data.
15Panel / Panel height
What it does
Choose automatic, price or oscillator placement and pane height.
How to use it
Drag the pane divider for an interactive resize.
16Horizontal levels
What it does
Add reference values to the indicator.
How to use it
Enter the levels expected by the editor.
17Plots
What it does
Set each plot visibility, line/bar/dot style, dash, color and width.
How to use it
Multi-line indicators expose several plots.
18Apply / OK / Cancel
What it does
Apply changes, apply and close, or discard draft edits.
How to use it
Use Apply to preview before closing.
Open the indicator manager
Choose Indicators or + Indicator from the chart. Select an available indicator, adjust its parameters and add it. Configured indicators appear in the chart strip; open one to edit its settings or remove it directly.
- Open Indicators from the toolbar or overflow menu.
- Choose the indicator and review its input period or data source.
- Apply it, then open its configured entry to adjust or remove it.
Overlay or separate pane
Price overlays share the price plot. Oscillators can occupy a separate pane inside the same chart window. Drag the pane divider to adjust its height. The time axis stays below the panes and the crosshair uses the same time coordinate.
Know the input
Price indicators can use candle data. Execution-based order-flow indicators require trades and aggressor classification. Their coverage can differ even when both are drawn on one chart.
Still need a hand?
Get in touch with the EdgeX team.