
Volume Profile: sessions, daily profiles and delta
Every profile control, price levels, volume values and data coverage.
Buttons & settings
Candles → Profile settings / Chart settings → Volume profile
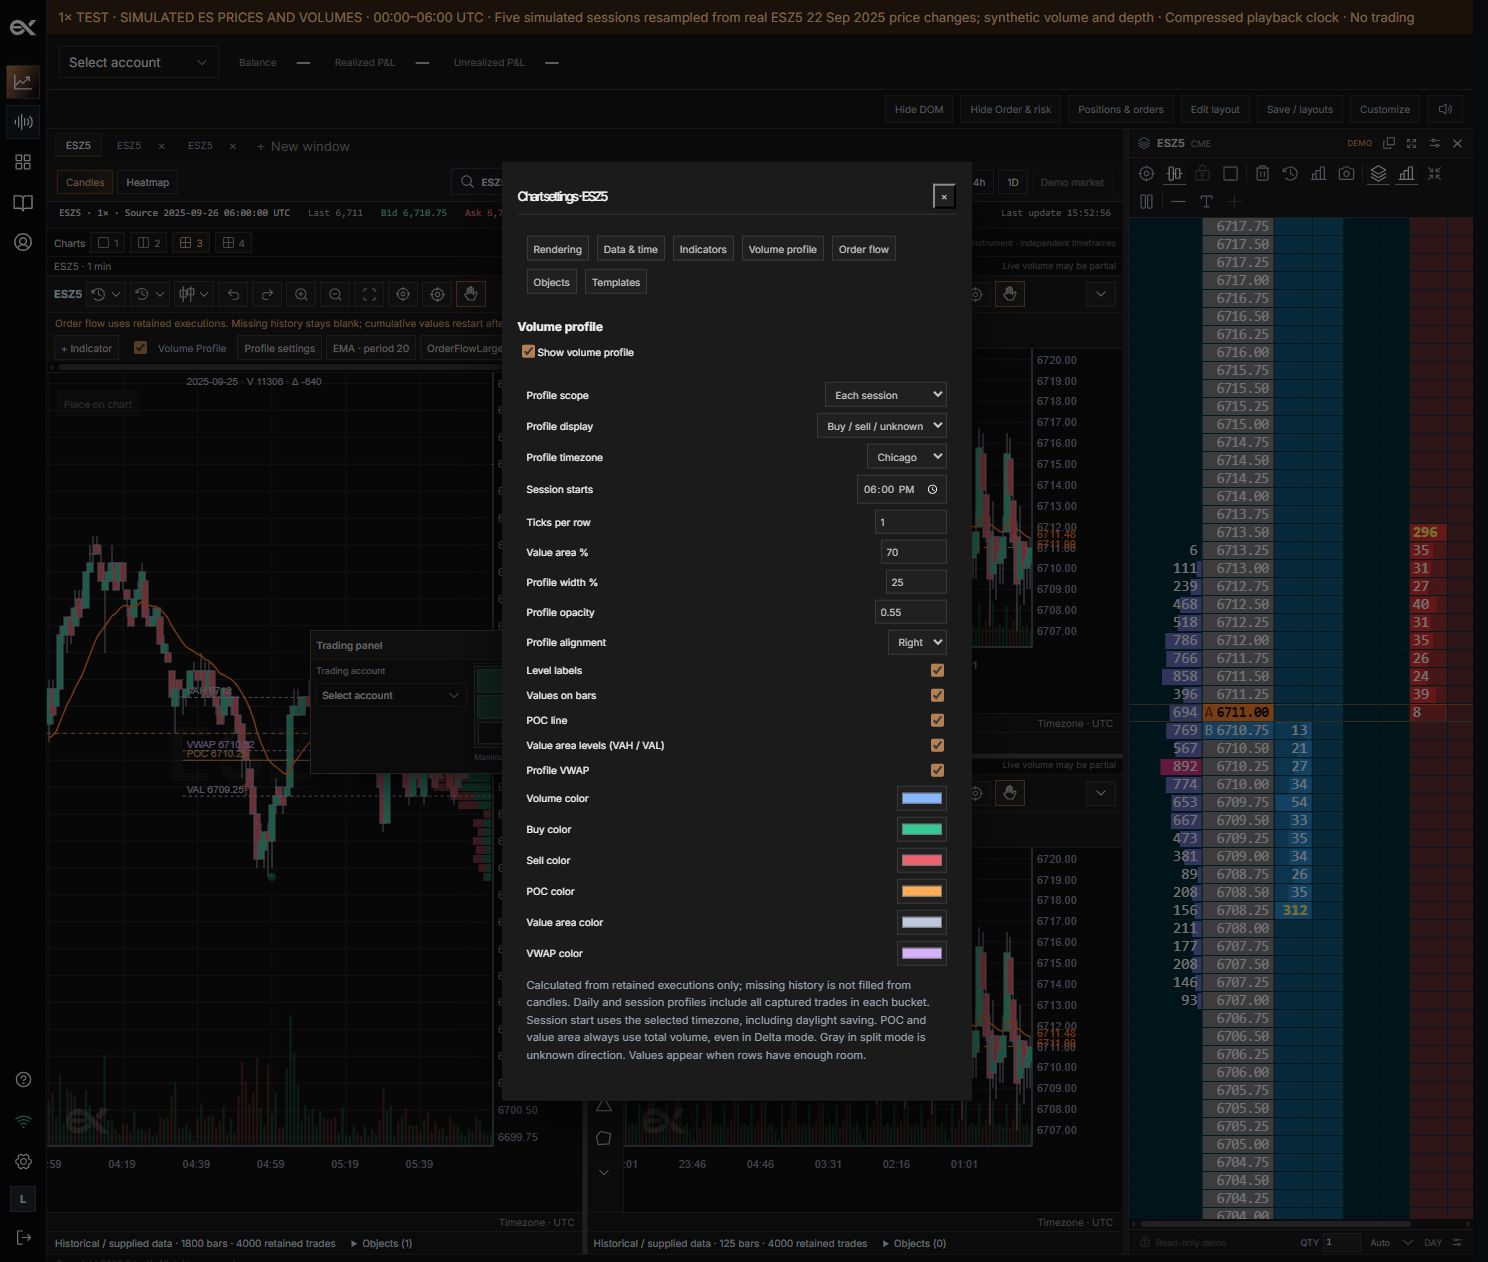
01Show volume profile
What it does
Enable the chart-level histogram.
How to use it
Independent VolumeProfile indicators have their own visibility.
02Profile scope
What it does
Choose visible range, each calendar day, each session or all retained trades.
How to use it
Daily/session buckets include their captured executions, not just the visible slice.
03Profile display
What it does
Choose total volume, signed delta or buy/sell/unknown.
How to use it
Delta = classified buys − classified sells.
04Profile timezone
What it does
Choose the timezone for daily/session boundaries.
How to use it
Chicago and New York follow daylight saving.
05Session starts
What it does
Set the local start of each session bucket.
How to use it
Available in Each session; this is not an exchange holiday calendar.
06Ticks per row
What it does
Group adjacent prices into wider histogram rows.
How to use it
Increase to reduce detail and improve readability.
07Value area %
What it does
Set the share of total volume covered around POC.
How to use it
POC/value area always use total volume, including Delta mode.
08Profile width %
What it does
Set histogram width within its available area.
How to use it
Change width without changing volume calculations.
09Profile opacity
What it does
Set transparency from 0 to 1.
How to use it
Lower it to see candles through the profile.
10Profile alignment
What it does
Anchor bars to the left or right.
How to use it
Each grouped profile stays within its displayed time region.
11Values on bars
What it does
Show row volume or delta when space permits.
How to use it
Zoom vertically or widen the profile if values do not fit.
12Level labels
What it does
Show or hide price labels for reference levels.
How to use it
Hide labels to reduce overlap on a small chart.
13POC line
What it does
Mark the highest total-volume row.
How to use it
Equal maxima select the lower price row.
14Value area levels
What it does
Show VAH and VAL.
How to use it
The algorithm expands from POC across occupied adjacent rows.
15Profile VWAP
What it does
Show the execution-volume-weighted average price.
How to use it
Uses the same captured bucket as the profile.
16Volume / Buy / Sell colors
What it does
Customize the histogram palette.
How to use it
Gray identifies unknown direction in split mode.
17POC / Value area / VWAP colors
What it does
Style the reference levels independently.
How to use it
These settings affect appearance, not calculations.
Open profile settings
Enable Volume Profile below the chart toolbar, then choose Profile settings. The same controls are in Chart settings → Volume profile. Independent VolumeProfile indicators have their own settings in the indicator editor.
- Choose Visible range, Each calendar day, Each session or All retained trades.
- For daily/session grouping, choose a timezone. For sessions, set the local start time.
- Choose Total volume, Delta or Buy / sell / unknown.
- Adjust ticks per row, value area percentage, width, opacity and alignment.
Session and daily boundaries
Daily profiles use midnight in the selected timezone. Session profiles use your configured start time and run until that time on the next local day. Chicago and New York follow daylight saving. This is a configurable session boundary, not an exchange holiday calendar. Each profile includes captured trades in that bucket, even when some fall outside the current view.
Values and levels
Values on bars shows row volume or signed delta when the row is tall and wide enough. Split mode separates sells, buys and unknown volume. POC is the largest total-volume row; equal maxima select the lower row. Value area expands from POC using adjacent occupied rows, selecting the upper row on equal volume, until the requested percentage is covered. VAH/VAL are its upper/lower rows. Profile VWAP weights actual execution prices by size. POC and value area use total volume in every display mode.
Appearance and coverage
Choose left/right alignment, width percentage, opacity and separate colors for volume, buy, sell, POC, value area and VWAP. Toggle values, level labels and each reference line independently. Missing trade history stays missing: five days of candles do not guarantee five complete daily profiles. Saved templates include these settings.
Still need a hand?
Get in touch with the EdgeX team.