The essentials
- Separate displayed orders from completed trades.
- Compare activity at the same contract, price and time.
- Treat observations as evidence to test, never as automatic entries.
The three layers of an order-flow view
A candlestick condenses a period into a small number of values. An order-flow workspace asks more specific questions: which prices traded, how much volume executed, and what happened to visible liquidity as price approached? Those questions require different data. A resting bid is willingness to buy at a displayed price; a completed trade records an actual transaction. Neither alone explains the next move.
CME’s liquidity methodology distinguishes bid and ask prices, available quantities and the cost of executing through book levels. The practical lesson is to avoid treating a single large number on a ladder as a complete measure of market conditions.
Reference: CME Group: liquidity methodology ↗
Aggressive buying is not the same as a bullish forecast
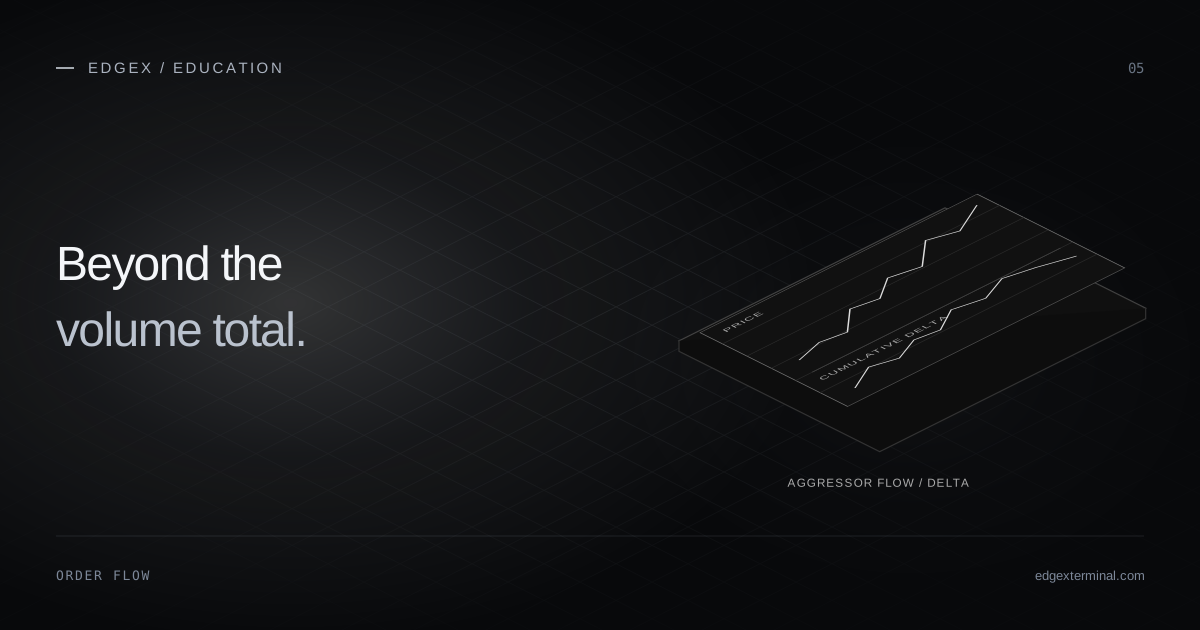
Every matched trade has a buyer and a seller. In an order-flow display, buy aggression usually refers to an execution classified as taking ask-side liquidity; sell aggression takes bid-side liquidity. The classification describes the transaction, not the trader’s identity, intention or ultimate profitability.
Price response matters. A burst of ask-side executions accompanied by progress through several prices describes a different observation from the same volume concentrated at one price. In the second case, there may be enough opposing supply to limit movement. A label such as absorption remains an interpretation of the observed sample.
Build a useful order-flow view in EdgeX
Start with one full futures contract, including expiry. Use the price chart for broader context, the DOM for current displayed depth, and Heatmap for the liquidity history actually captured. Add the execution or delta view only after confirming that the feed supplies the necessary trades. More panels cannot repair missing data.
EdgeX keeps these views in one browser workspace. This makes it practical to compare price, book and executions without repeatedly changing applications. The benefit is a more consistent observation process; it is not proof of lower latency, better fills or a profitable strategy.
- Check the selected contract and environment before analysis.
- Compare market-data status and order-channel status separately.
- Use the same time interval when comparing a pattern with its price response.
- Read coverage notices before interpreting a blank or quiet display.
An observation exercise before placing orders
Choose a short research session and write down one question, such as whether displayed liquidity tends to remain when price approaches a selected level. Record the starting time, contract and settings. Observe several approaches, including the uneventful ones, rather than collecting only dramatic screenshots.
For each observation, describe the data first: price range, executed quantity, visible depth and any interruption. Then record your interpretation separately. Finally, note what occurred afterward over a consistent interval. This separation reduces the temptation to rename a failed prediction after the outcome is known.
Demo market is useful for learning the controls, but EdgeX demo prices and depth are synthetic. Use appropriately entitled connected data when researching real market behavior. Simulated or historical observations still do not establish how an order would have filled in a live queue.
Common mistakes that weaken the analysis
Mixing two contract expiries, changing detector settings halfway through a comparison, or treating missing history as zero activity can all create misleading results. A visually compelling heatmap is only as useful as its coverage and the question being asked.
Keep your first workspace deliberately small. Learn what each number measures before adding another detector. Read the EdgeX setup and history guides below, then repeat the same observation process with documented settings. Consistency gives you something you can review; a crowded screen alone does not.
Common questions
Can I learn order flow without trading live?
Yes. Learn the controls with synthetic demo data, then study appropriately entitled market data or a suitable simulation. Keep those environments separate in your records; simulated outcomes do not establish live execution performance.
Does order flow replace risk management?
No. It describes market observations. Position size, order behavior, connection status and loss limits remain separate parts of a trading plan.
Continue with the EdgeX product guides
These guides document the controls and data behavior used in this article.
Published by EdgeX Terminal, operated by EdgeProp Trading S.R.L. Product explanations are based on the EdgeX Help Center; external references are linked beside the relevant discussion. Examples are illustrative, not actual trading results. Futures trading involves risk; this material is education, not an individual trading recommendation.
Suggest a correction ↗