
Move, scale and reset your chart
Cursor modes, wheel zoom, price and time scales, and compact toolbars.
Buttons & settings
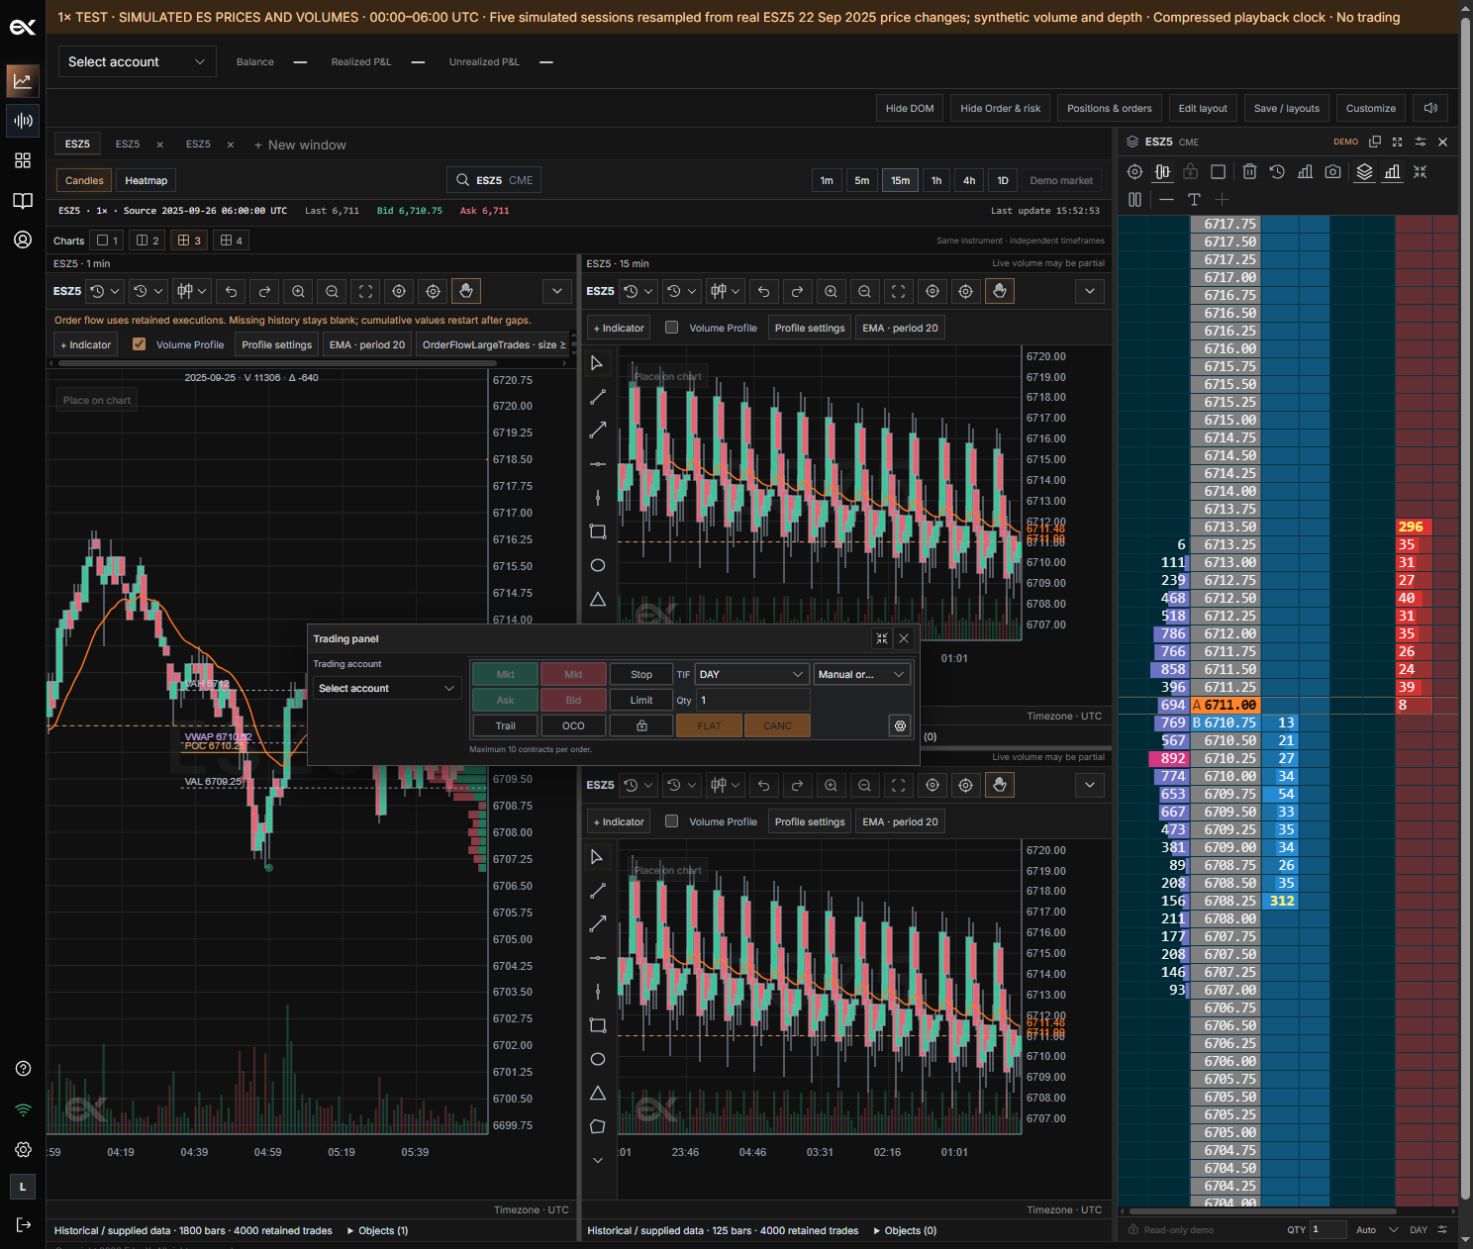
Trading station → Candles → chart toolbar
01Hand
What it does
Drag the plot to move the chart.
How to use it
Select Hand, then drag; it does not move orders.
02Crosshair
What it does
Show a shared time/price reference and data readout.
How to use it
Select the crosshair icon or middle-click to switch cursor mode.
03Zoom in / Zoom out
What it does
Change the number of visible bars.
How to use it
Use +/− or the mouse wheel over the plot.
04Fit chart / Latest
What it does
Restore a usable scale or return to the latest bars.
How to use it
Use after panning away from current data.
05Price scale
What it does
Adjust vertical price spacing.
How to use it
Drag the scale on the right.
06Time scale
What it does
Adjust horizontal bar spacing.
How to use it
Drag the time axis below the chart panes.
07More chart commands
What it does
Reveal commands hidden by a narrow panel.
How to use it
Open the downward arrow; hover icons to read their tooltips.
Navigate the price chart
The hand tool moves the view. Crosshair mode aligns the time and price readout with your pointer. Middle-click toggles the cursor mode; the toolbar provides the same choice.
- Select the hand and drag the plot to reposition it.
- Use the mouse wheel to zoom; drag the right price scale to adjust vertical spacing.
- Adjust the time scale to change horizontal spacing. Use Fit chart or Latest to restore the view.
Smaller chart windows
As a panel narrows, commands show icons instead of labels. The arrow opens More chart commands when even the icons do not fit. Hover an icon to identify its action. All chart settings remain available from this menu.
Instrument precision
Price labels and drawings follow the selected contract tick size. Zooming in allows finer tick spacing; changing the display scale does not change the contract tick size.
Still need a hand?
Get in touch with the EdgeX team.